
 | marketing@wsdks.com |  | +8617712621386 |  | No. 8 Jinwei Road, Changshu City, Jiangsu Province, P.R.China |


Zero Liquid Discharge Flow Diagram Guide
A zero liquid discharge flow diagram is a decision map, not a universal plant design. Read the main liquid path from feed to solids, then trace recovered-water outlets, residuals, recycles, purges, and the data required at every handoff.
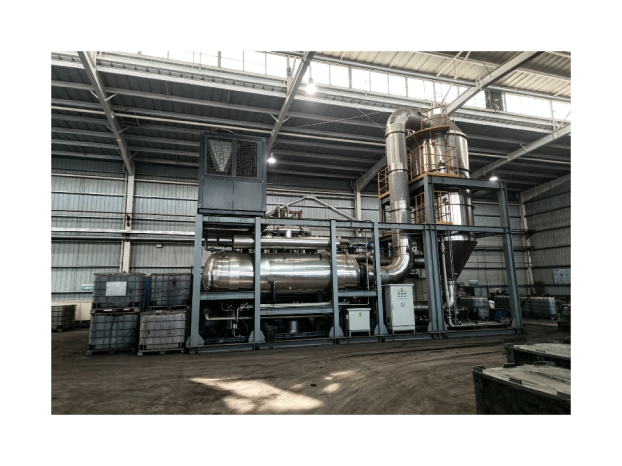
The purpose of a zero liquid discharge flow diagram is to make the system boundary visible. It should show what enters the treatment train, how each stage changes the stream, where recovered water goes, and how concentrate and solids leave the boundary. VIFLUTER's zero liquid discharge solution categories provide application context for this reading exercise.
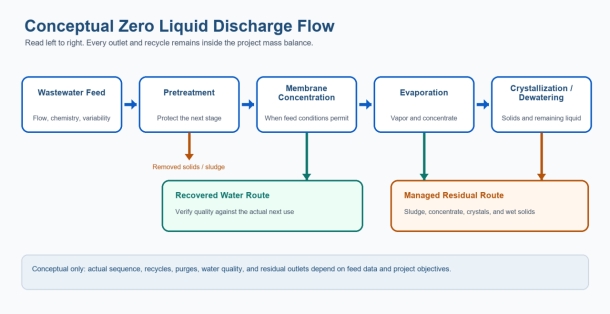
Figure 1. Conceptual ZLD flow. Actual unit operations and outlets depend on the feed and project boundary.
How to read a zero liquid discharge flow diagram
Start with the arrows rather than the equipment names. The main path shows how liquid volume and composition change. Side arrows identify recovered water, removed solids, cleaning waste, vents, or other outlets. Return arrows represent recycle streams. A dashed or unlabeled line should never be ignored because an unaccounted purge can change whether the boundary is truly ZLD.
Next, ask what design information is required at each arrow. Flow, temperature, pH, dissolved and suspended material, organics, oil, additives, and variability may all matter. A useful diagram links those properties to the duty of the downstream stage.
Feed and equalization define the starting envelope
The feed block should identify which wastewater streams are included and whether they are combined or segregated. Equalization may smooth hydraulic or chemical peaks, but it cannot replace characterization. The diagram should state average and peak flows, operating schedule, temperature, and the events that create unusual loads, such as batch cleaning or product changes.
Pretreatment protects the concentration stages
The pretreatment block may represent screening, oil separation, precipitation, clarification, filtration, adsorption, or another targeted method. The diagram does not need to show every valve, but it should explain the intended duty. Examples include reducing suspended solids, controlling hardness, removing free oil, or stabilizing pH. It should also show the resulting sludge or spent-media outlet.
Membrane concentration separates water from brine
Where membrane concentration is feasible, the diagram divides the feed into a recovered-water stream and a smaller, more concentrated reject. The membrane block should identify the required permeate quality and the reject conditions that the next stage must accept. Recovery is not a stand-alone design target; higher recovery can increase osmotic pressure, scaling, fouling, and chemical concentration.
Evaporation and crystallization complete different duties
The evaporation block converts part of the remaining water into vapor, separates entrained droplets, and condenses the vapor. The liquid leaving the evaporator is more concentrated and may be sent to crystallization. The crystallizer manages supersaturation so selected dissolved material forms separable solids. Depending on the feed, a centrifuge, filter, dryer, or another dewatering step may follow.
The public industrial wastewater ZLD process overview describes a staged combination of pretreatment, membrane concentration, evaporation/crystallization, and residual drying. The conceptual figure in this article reorganizes those verified functions into an original reading guide; it does not copy the site's or brochure's process graphics.
Recovered-water and residual outlets need equal attention
A diagram is incomplete if it highlights recovered water but hides residuals. Membrane permeate and evaporator condensate may have different quality and may require polishing or monitoring before reuse. Pretreatment sludge, mother liquor, crystals, wet solids, cleaning waste, and off-spec liquid also need characterized destinations. ZLD removes a routine liquid-discharge outlet from the defined boundary; it does not make residual management disappear.
Show recycles, purges, and control points
Recycle streams can improve recovery or stabilize operation, but they may also accumulate contaminants. Every recycle should have a defined source, destination, composition, and control basis. If a purge is required to prevent buildup, it must be included in the mass balance and assigned a treatment or residual route.
Key control points may include flow, pressure, temperature, conductivity, pH, level, heat-transfer performance, and product or residual quality. The diagram should show where measurements support decisions rather than trying to become a detailed piping and instrumentation diagram.
What changes for different wastewater feeds?
Feed condition | Possible diagram change | Question to resolve |
High suspended solids or free oil | Add targeted removal before membranes or evaporation | What load must be removed to protect the next stage? |
High hardness or scaling tendency | Add chemistry control, softening, seeding, or a different concentration limit | Where will precipitation occur and how will solids leave? |
Volatile organics | Add vapor-control or condensate-polishing steps | What can transfer with vapor, and what quality must the condensate meet? |
Mixed salts and high viscosity | Change evaporation/crystallization sequence and testing requirements | How do concentration, crystal behavior, and pumping change? |
Variable batch discharge | Add segregation, storage, or equalization | Which peak condition defines capacity and control? |
Design-input checklist for the next version of the diagram
·Identify every wastewater source and the operating event that creates it.
·Add average, peak, and batch flow information at the feed boundary.
·State the duty and outlet of each treatment block.
·Show permeate, condensate, sludge, concentrate, crystals, cleaning waste, recycles, and purges.
·Label the actual next use for recovered water and the approved residual destinations.
·Separate the conceptual process diagram from any future PFD or P&ID used for engineering design.
Turn the conceptual map into a project-specific flow
A zero liquid discharge flow diagram becomes actionable when its arrows carry real project data and every outlet has an owner. To develop the next project-specific version, share the process inputs with VIFLUTER including the stream list, flow profile, analysis, recovered-water target, utilities, and residual routes.
Sources and further reading
·Tong and Elimelech, The Global Rise of Zero Liquid Discharge for Wastewater Management, Environmental Science & Technology, 2016.
·Yaqub and Lee, Zero-liquid discharge technology for resource recovery from wastewater, Science of the Total Environment, 2019.